

A Hall of Mirrors of the Healthy Vaccinee Effect by Tomas Fürst at Brownstone Institute
The following is the result of joint work with Jaroslav Janosek, Tadeas Frycak, and Robert Straka.
Introduction
Since the registration trials of the Covid-19 vaccines, there have been no randomized studies to track the efficacy of these vaccines. The virus kept mutating and the convalescent fraction of the population has been growing. Thus, the original efficacy figures reported in the registration trials – dubious to start with – were clearly not valid when the mass vaccination campaign started in early 2021. Moreover, in the meantime we learned that the registration trials tested a different product than the one used in the mass vaccination campaign. This cast further doubt on the advertised 95% efficacy against symptomatic infection.
The Israel 2021 summer wave of infections clearly demonstrated to the whole world that the “vaccines” do not protect against symptomatic infection in any meaningful way. Consequently, the goal posts were moved and the authorities started claiming that the “vaccines” may not protect against infection but they protect against severe course of infection, hospitalisation, and death from Covid. However, there were (and there still are) no data from randomized trials to support this causal claim.
This embarrassing gap in evidence was filled by a trove of papers that estimated the effectiveness of the “vaccines” from observational data. Most of these studies claimed the vaccine effectiveness was very high, often close to 100%. Rogue governments all over the world used these studies to force people into vaccination.
Readers of this forum know very well that observational data are loaded with the so-called Healthy Vaccinee Effect. This is a type of indication bias that originates from healthy people having easier access to the vaccine. For example, people on their deathbed are usually not vaccinated, which means that deaths tend to concentrate in the unvaccinated group, making the vaccinated group much “healthier.”
At the same time, those frailest individuals who are close to the end of their lives are also those most susceptible to die from/with Covid. Healthy Vaccinee Effect (HVE) thus causes observational studies to vastly overestimate vaccine effectiveness against any endpoint (and vastly overestimate vaccine safety as well). The now legendary paper by Tracy Hoeg, Ram Duriseti, and Vinay Prasad showed that the reported 95% effectiveness of Covid vaccines against Covid-related death in Israel in 2021 was entirely due to HVE. In other words, had HVE been removed, the true vaccine effectiveness would have been zero. I still can’t figure out how they got this published in the New England Journal of Medicine.
Try to Explain HVE to a Professor
We first noticed HVE in the middle of 2021 when Angelika Bazalova – an investigative journalist – had the brilliant idea to FOIA her way to the records on all-cause mortality of the clients of several health insurance companies in the Czech Republic. Readers (with an AI translator from Czech) can still see our initial confusion as we were reporting the data and proposing possible explanations (one of the articles was titled “The elixir of youth”). After some time, we made sense of all the data and reported it in a paper for the International Journal of Infectious Diseases and in a further paper in a Polish journal.
My original conclusion that “this paper invalidates all estimates of vaccine effectiveness based on observation data” was changed to “In view of the presence of HVE, the baseline difference in the frailty of vaccinated and unvaccinated populations in periods without COVID-19 must be taken into account when estimating COVID-19 vaccine effectiveness from observational data.” But that is the Newspeak we all had to learn during the past years in order to get anything published in official journals.
Since then, we have been trying to explain HVE to medical professionals, policymakers, researchers, and the public. It has been frustrating. Most people think that the vaccines work because they keep hearing it from all the media. So, when they see data which seemingly confirm their prior belief – the unvaccinated are dying at a much higher rate than the vaccinated – they cannot make themselves think about any other explanation apart from the convenient one – that the vaccines have prevented these deaths.
When you suggest that it is weird that the vaccines seem to protect against deaths unrelated to Covid, they usually acknowledge that it is weird, but the “Aha” moment of understanding rarely comes that HVE invalidates everything they “knew” about vaccine effectiveness.
Three Illusions of Vaccine Effectiveness
In order to better understand HVE and to be able to explain it more clearly to everyone, we proposed a simple simulation model that can help us to understand three important and common types of misinterpretation of observational data that originate from ignoring the HVE:
1. An illusion of vaccine efficacy
2. An illusion of vaccine waning efficacy
3. An illusion of vaccine-related mortality
We first present a simple model (Model 1) of a placebo vaccine (i.e., a vaccine with zero efficacy and no adverse effects) with no HVE as a sanity check and baseline. Then we make a slight amendment to the model (Model 2), introducing the Healthy Vaccinee Effect controlled by two parameters, the HVE duration, and HVE magnitude. We will still assume the same placebo vaccine as in Model 1. We will show how the three illusions described above naturally appear in the observational data.
Model 1: A Sanity Check
First, we developed a simple model simulating a placebo vaccine, i.e., a vaccine with zero efficacy and no adverse effects. We simulated a population of one million people observed for 100 weeks (700 days, approx. 2 years). Two percent of the population were randomly selected to die during the observed period. The day of death was selected randomly from a uniform distribution over the 700 days. Next, 80% of the population was randomly selected to receive the placebo vaccine. The day of vaccine administration was selected from a normal distribution with a mean of 6 months (168 days) from the beginning of the simulated period and a standard deviation (SD) of 1 month (28 days). Should an individual who had already died be selected for vaccination, the vaccine was simply not administered.
This simulation produced a population of a million individuals, of whom about 20,000 died during the two-year follow-up, and about 800,000 received a placebo vaccine sometime between month 3 and month 9 of the 100-week period. The vaccine administration and death were completely independent in this baseline simulation model.
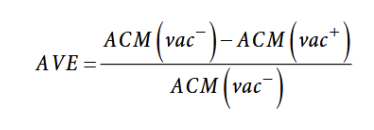
For each week, we calculated the mortality rate of the vaccinated as the number of vaccinated individuals who died in that particular week divided by the number of person-days spent by all vaccinated individuals in that week. The mortality of the unvaccinated was calculated accordingly. Apparent vaccine effectiveness (AVE) for each individual week of the study period was computed as:
where ACM(vac-) is the mortality rate of the unvaccinated, and ACM(vac+) is the mortality rate of the vaccinated individuals.
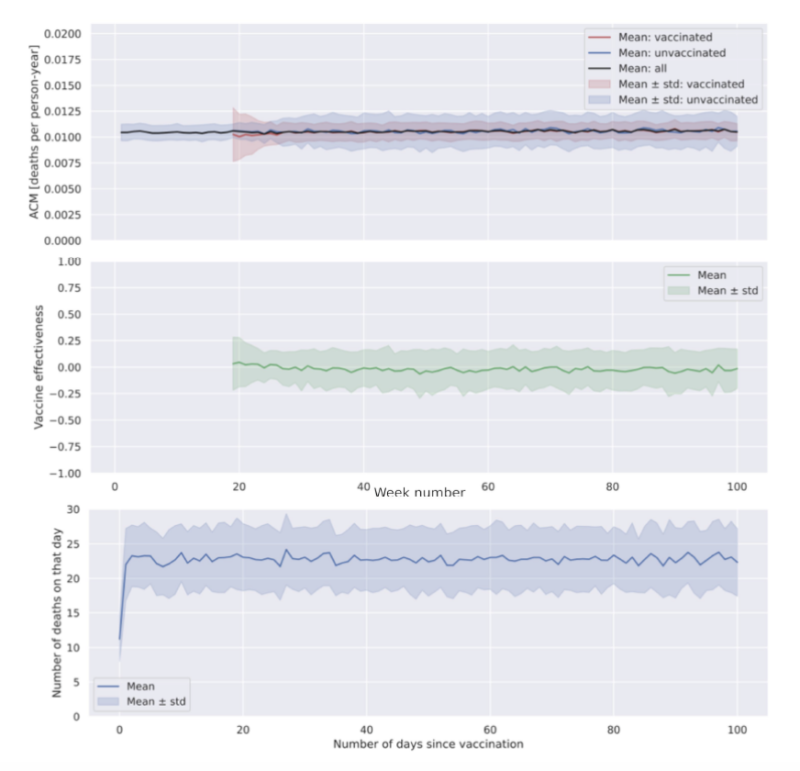
The results were visualized as a plot of the average mortality rates from 100 runs of the baseline model supplemented with standard deviations (Figure 1). By the design of the baseline model, mortality values in both groups are approximately constant and equal to 0.01 deaths per person-year. The slight upward trend in the plot is caused by the gradual decrease in the population size due to deaths (no births were assumed). At the beginning of the vaccination campaign (before week 20), the variability in the mortality of the vaccinated is large due to their low numbers and the data are not presented.
The bottom panel of Figure 1 shows the number of deaths (average and standard deviation from 100 runs of the baseline model) as a function of the number of days from vaccination. On Day 0 (the day of vaccination), the model shows about half as many deaths as on subsequent days because it accounts for a real-world probabilistic situation: assuming an even distribution of vaccinations and deaths over the day, about half of the people who were due to both die and be vaccinated on that day would die before receiving the vaccine, and half after.
Figure 1. The evolution of the vaccinated and unvaccinated mortality rates (top panel) and the apparent vaccine effectiveness (middle panel) over time in the baseline model. The ACM of the vaccinated (and the apparent vaccine effectiveness) are tracked from week 19, when there was at least one deceased vaccinated individual in each of the 100 model runs. Average number of deaths in the vaccinated group as a function of the number of days from vaccination (bottom panel).
Model 2: Healthy Vaccinee Effect
To include HVE in the simulation, a small modification was introduced into the baseline model. The first two steps (selecting 2% of the population who would die at a uniform pace over the observed period and randomly selecting approximately 80% of the population who would receive the placebo vaccine, with the time of vaccination normally distributed with mean = 6 months and SD = 1 month) remained the same as in the baseline model. HVE was introduced only in the next step, to imitate the situation when individuals close to death are less likely to get vaccinated.
We simulated the HVE by cancelling (with a certain probability) the administration of any vaccine that was given less than k days before the individual’s death. The probability of cancelling the vaccine was simulated as a linearly decreasing function of the time to death, starting at p (the maximum magnitude of HVE, valid for those who die on the day they are vaccinated) and gradually decreasing to 0 (for those who die k or more days after the day of vaccination).
For example, if p = 0.5 and k = 20 days, the HVE steps proceeded as follows: 50% of the vaccines that were due to be administered to individuals who died on the very day of vaccination were cancelled (i.e., not administered). Next, 47.5% of the vaccines due to be given to individuals who died one day after vaccination were cancelled, followed by 45% of the vaccines due to be given to individuals who died two days after vaccination, etc. No vaccines that were to be administered to those who died 20 days or more after the vaccine were cancelled in this example. The outcomes of the simulation were plotted in the same way as in the baseline model.
This small change to the baseline model introduced a correlation between the events of receiving the placebo vaccine and dying. The change in the total number of administered vaccines was very small indeed: for the parameters used in this example (i.e., k = 20 days and p = 0.5), only about 115 out of 800,000 vaccines were not administered. Still, even this seemingly negligible change was sufficient to substantially alter the results of the simulation (see Figure 2).
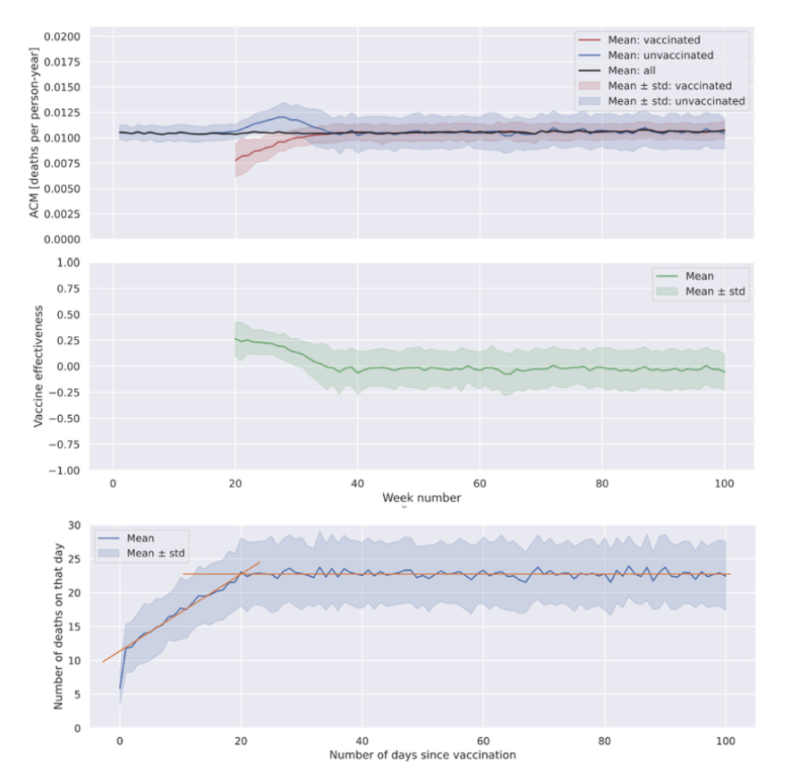
Not administering a mere 115 vaccines to individuals close to death produced an obvious departure from the baseline model that lasted for weeks. During the vaccination campaign, the mortality of the unvaccinated increased as those about to die concentrated in the unvaccinated group. Because the overall mortality did not change – the simulated vaccine had neither protective nor adverse effects – the mortality of the vaccinated individuals therefore dropped below the baseline. This produced an illusion of vaccine effectiveness (see Figure 2, middle panel).
We can also see that with decreasing vaccination intensity, the apparent vaccine effectiveness caused by HVE dwindled to zero, producing an illusion of vaccine waning effectiveness. It is worth noting that the illusion of vaccine effectiveness extends well beyond the period defined by k. In the current example, the apparent vaccine effectiveness dropped to zero only after about 15 weeks (105 days) from the start of its tracking, despite k being only 20 days.
The bottom panel of Figure 2 plots the number of deaths as a function of the number of days from vaccination. Note the gradual increase in the plot (compared to Figure 1), consistent with the drop in mortality immediately after vaccination, which then slowly returns to a steady level. Many observers mistook this effect for evidence of vaccine-related mortality (see, e.g., this post by Steve Kirsch). However, it is only another of the Janus faces of the Healthy Vaccinee Effect.
On this synthetic dataset, both parameters of the HVE simulation (k and p) can be easily read off the curve in the bottom panel of Figure 2 (see the auxiliary red lines): The HVE duration (k = 20 days in this case) can be derived as the number of days after which the graph levels off. The HVE magnitude (p = 0.5) can be estimated by the initial attenuation of the graph, i.e., 1 minus the ratio of the number of deaths on Day 1 (approx. 12 in this example) to the daily number of deaths after the graph stabilizes (approx. 23). This would lead to the estimation of p ≈ 1−(12/23) = 0.48. This way of plotting the data can be used in practice to estimate the parameters of HVE in observational studies.
Figure 2. HVE model (zero-effect vaccine with HVE magnitude of p = 0.5 and duration of k = 20 days). The evolutions of mortalities within the vaccinated and unvaccinated groups are shown in the top panel, evolution of the apparent vaccine effectiveness in the middle panel (horizontal axes in weeks). Note that in this example, even HVE of short duration (k = 20 days) produced a substantial optical illusion of vaccine effectiveness that lasted for approximately 15 weeks from the start of tracking in week 20. The bottom panel shows numbers of daily deaths (means and standard deviations from 100 runs of the HVE model) as a function of the number of days from vaccination in the vaccinated group in the HVE model (zero-effect vaccine with HVE magnitude of p = 0.5 and duration of k = 20 days). The auxiliary lines are drawn as an aid to derive the k and p parameters.
By adjusting the parameter p, we can achieve almost arbitrary “initial effectiveness” of the placebo vaccine. By adjusting k (and/or the duration of the vaccination campaign), we can achieve an arbitrary rate of “waning effectiveness.” See The Hall of Mirrors article that we published in Frontiers for further details, analyses of the effects of changing k and p, comparison to real-world data, Bayesian methods for estimating k and p, and many more mathematical niceties.
How to Get It published
We first came forward with a version of this model in February 2023. It took some time before the model was polished and the language was toned down sufficiently that we could submit it to an academic journal. We submitted it to the International Journal of Modelling and Simulation in September 2025. Half a year later, the editors were apparently still staring at it with horror because no reviewers had been assigned, despite repeated reminders. Hence, we withdrew the paper and sent it to Frontiers, put up a fight with several reviewers, and finally got it published in the summer of 2026.
We had to step carefully, tone down the language at several places, and pretend that the paper does not invalidate all estimates of vaccine effectiveness based on observation data – which it, in fact, does. Only here, on the pages of Brownstone Journal, can we afford the full and honest…
…Conclusion
We have presented a very simple model of the so-called Healthy Vaccinee Effect – a type of indication bias that arises when people close to death are less likely to get vaccinated. It is well-known that HVE is present in Covid-19 vaccine observational data.
We have shown that HVE (1) creates an illusion of a protective effect of the vaccine against death from any cause, (2) produces an illusion of vaccine waning efficacy, and (3) causes an anomalous pattern in the relation between the time from vaccination and the number of deaths in that time, which may be mistaken for vaccine-related mortality. In our example, not administering a mere 115 out of 800,000 placebo vaccines to dying people created a very pronounced and long-lasting illusion of vaccine effectiveness.
All studies that use observational data to infer vaccine effectiveness and/or safety – i.e., all such studies except for prospective randomized trials – very likely suffer from major distortions due to HVE. All claims about Covid-19 vaccine effectiveness and safety based on observational data are, therefore, probably misleading and should be revised.
Original Author: Tomas Fürst | Source: Brownstone Institute
 70.924 SRY